Where are the error logs?
By the end of this guide, you will learn how to easily check the WordPress error logs in three simple steps.
Here’s what’s inside this article:
Ready? Let’s get started!
A WordPress error log is a record of error messages generated by the website, which includes the details of the errors along with their dates and times.
These logs are important for diagnosing and resolving issues, as they provide information about the source of the problem, such as a specific plugin, theme, or code snippet.
Once WordPress debug mode is enabled, these error messages are collected in a file, typically named debug.log, located in the /wp-content/ directory.
👉 Related: The Ultimate Guide to WordPress Error Troubleshooting
It’s also important to consider the backbone of your WordPress site’s performance and reliability—your web hosting service.
This brings us to the forefront of hosting solutions that are not just reliable but also affordable and user-friendly: Hostinger.

Discover the Hostinger advantage for your WordPress site:
Choosing Hostinger not only ensures your WordPress site is hosted on a robust platform.
But that it also provides peace of mind knowing that you’re supported every step of the way.
To check WordPress error logs and identify issues on your site, follow these detailed steps:
There are two ways to enable WordPress debug mode:
Any of those methods would enable error logging on your website.
For this, you must first access your website’s files using an FTP client like FileZilla or the file manager in your hosting control panel.
Once you have access, you need to locate the wp-config.php file, which is typically found in the root directory of your WordPress installation.
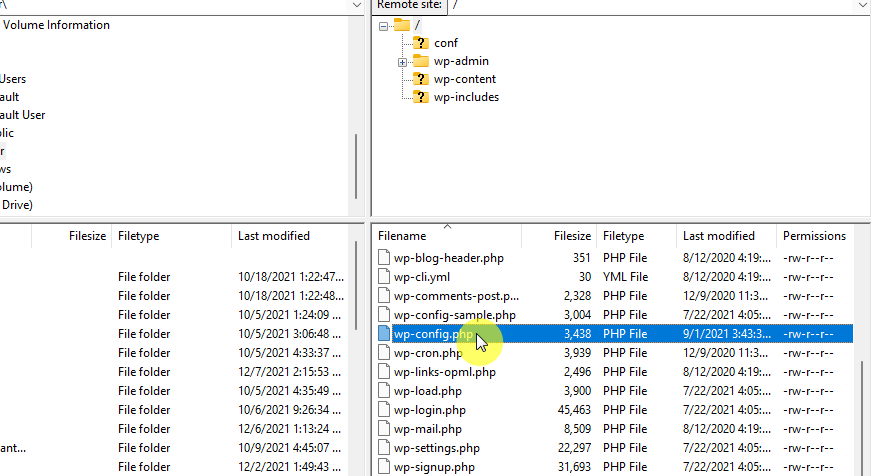
When you find the file, you must edit it by inserting specific lines of PHP code just before the line that reads /* That's all, stop editing! Happy blogging. */:
php
define( 'WP_DEBUG', true );
define( 'WP_DEBUG_LOG', true );
define( 'WP_DEBUG_DISPLAY', false );
@ini_set( 'display_errors', 0 );
This code enables WordPress’s debug mode, logs errors to a file, and prevents errors from being displayed to site visitors.
If you prefer not to edit files directly, you can use a plugin like WP Debugging to enable debug mode.
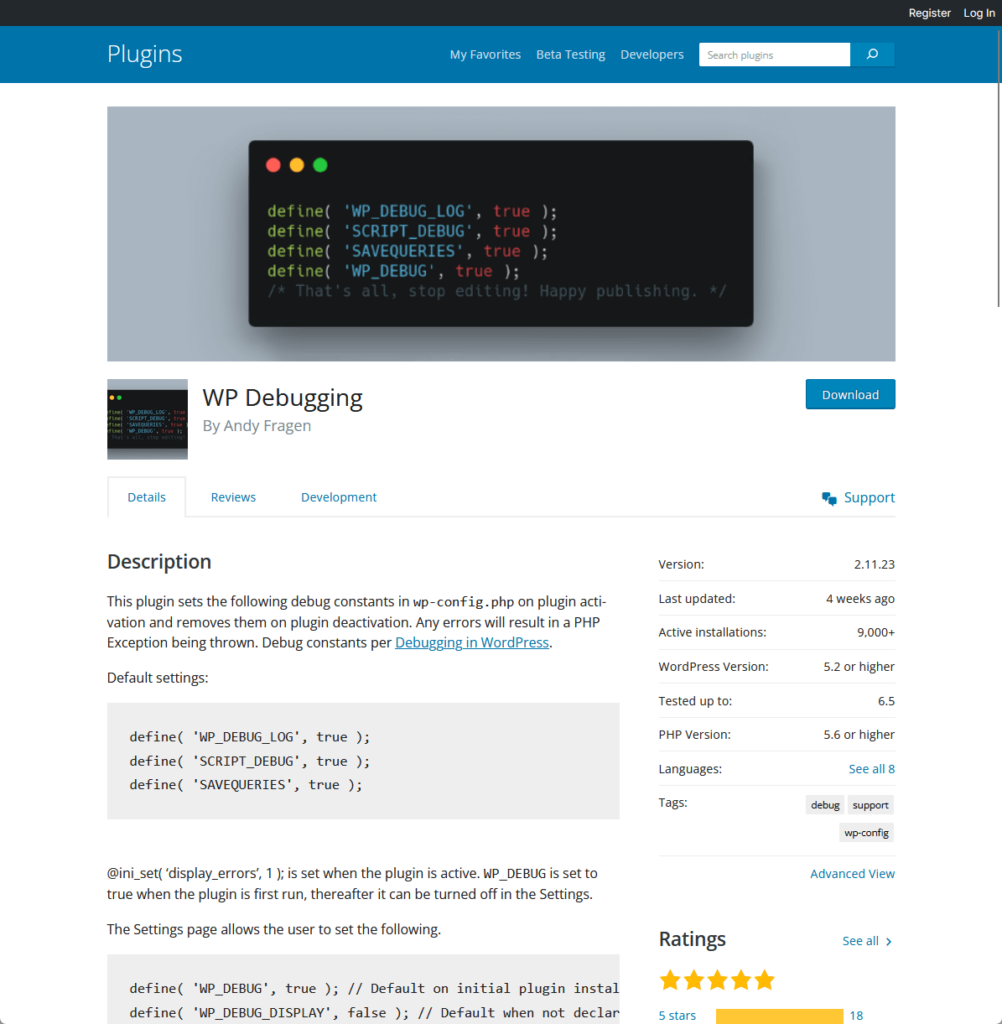
To use this method:
Once you find it, install the plugin by clicking the install now button and then activate it after the installation is complete.

After the activation, this plugin will automatically configure the necessary settings to enable WordPress’s debug mode.
Once you have enabled debug mode on your WordPress site, the next critical step is to replicate the conditions that led to the errors you’re investigating.
This is important because the debug log only captures errors as they occur — no historical data from before debug mode was activated.
To generate fresh entries in the debug log, you should methodically revisit your site and interact with it in the same manner that initially produced the errors.
To access your WordPress site’s debug log, replicate the initial step by connecting to your site’s files via an FTP client or your hosting control panel’s file manager.
Once connected, navigate to the /wp-content/ directory where you should locate a file named debug.log.
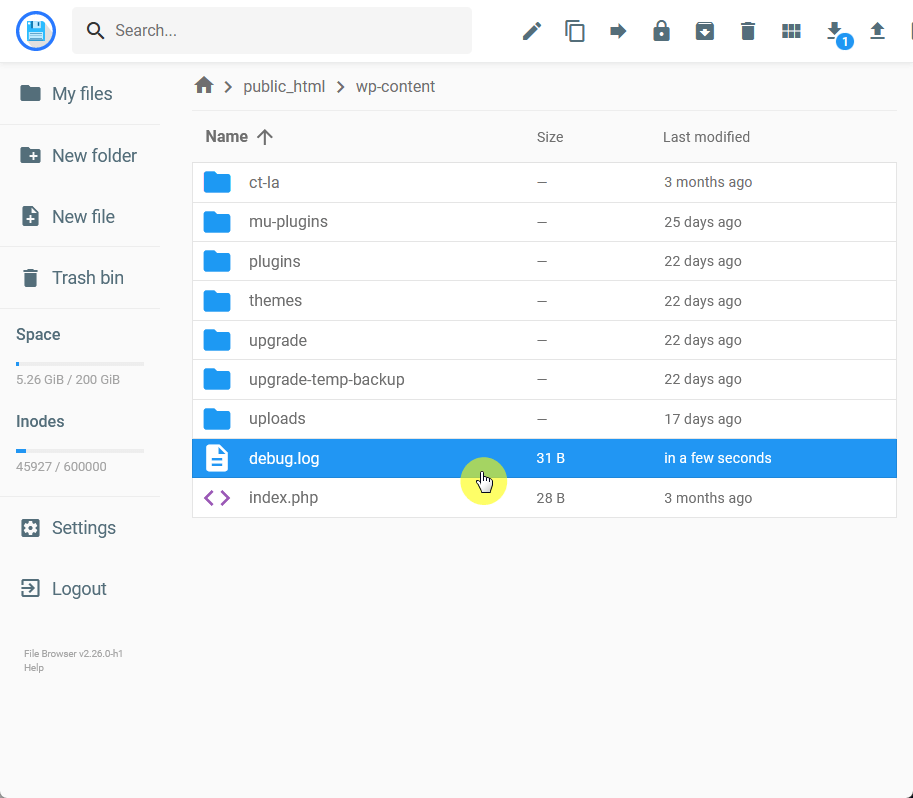
Upon finding the file, proceed to download, view, or edit it to scrutinize the error messages it contains.
The log entries are detailed, with info such as:
These are all instrumental in pinpointing and resolving the issues that your site is experiencing.
After completing all the steps mentioned, you can now use the information from the debug log to troubleshoot and resolve errors.
After fixing the problems, it’s better to turn off debug mode — this stops the log file from getting too big and shields private details from being exposed.
You can do this by simply reversing the steps taken in the first step, which is to set that script to false or deactivate the plugin.
Wrapping up, it’s time to consider elevating your website’s design and functionality.
The perfect way to achieve this is through Elementor template kits, and Darrel Wilson has an offer you can’t afford to miss.

Secure lifetime access to all premium Elementor template kits:
With Darrel Wilson’s Elementor template kits, transform your website into a stunning, high-performing, and user-friendly platform